
From Download to Request Bodies: Your First WePROXA Capture
When an API call fails, the browser console usually shows only part of the story. You still need to know what the app actually sent, what the server returned, and whether a proxy, cache, or client changed anything along the way.
WePROXA puts that exchange in one place. This walkthrough starts with a new installation and ends with a captured HTTPS request whose headers and bodies you can inspect.
What you will do
Section titled “What you will do”By the end of this guide, you will have:
- installed WePROXA on macOS or Windows;
- started the local capture proxy;
- trusted the local CA certificate for HTTPS inspection;
- enabled SSL interception for one test host; and
- opened both a JSON request body and its response body.
The complete setup normally takes only a few minutes.
1. Download and install WePROXA
Section titled “1. Download and install WePROXA”Follow the macOS installation guide to choose the Apple Silicon, Intel, or universal build. You can also install the latest release from Terminal:
curl -fsSL https://weproxa.com/i | bashIf you download the DMG instead, open it, drag WePROXA into Applications, and launch the installed copy—not the copy still mounted inside the DMG.
Windows
Section titled “Windows”Install WePROXA from the Microsoft Store, or run this command in Command Prompt:
winget install weproxaThe Windows installation guide covers Store updates, proxy permissions, and certificate setup in more detail.
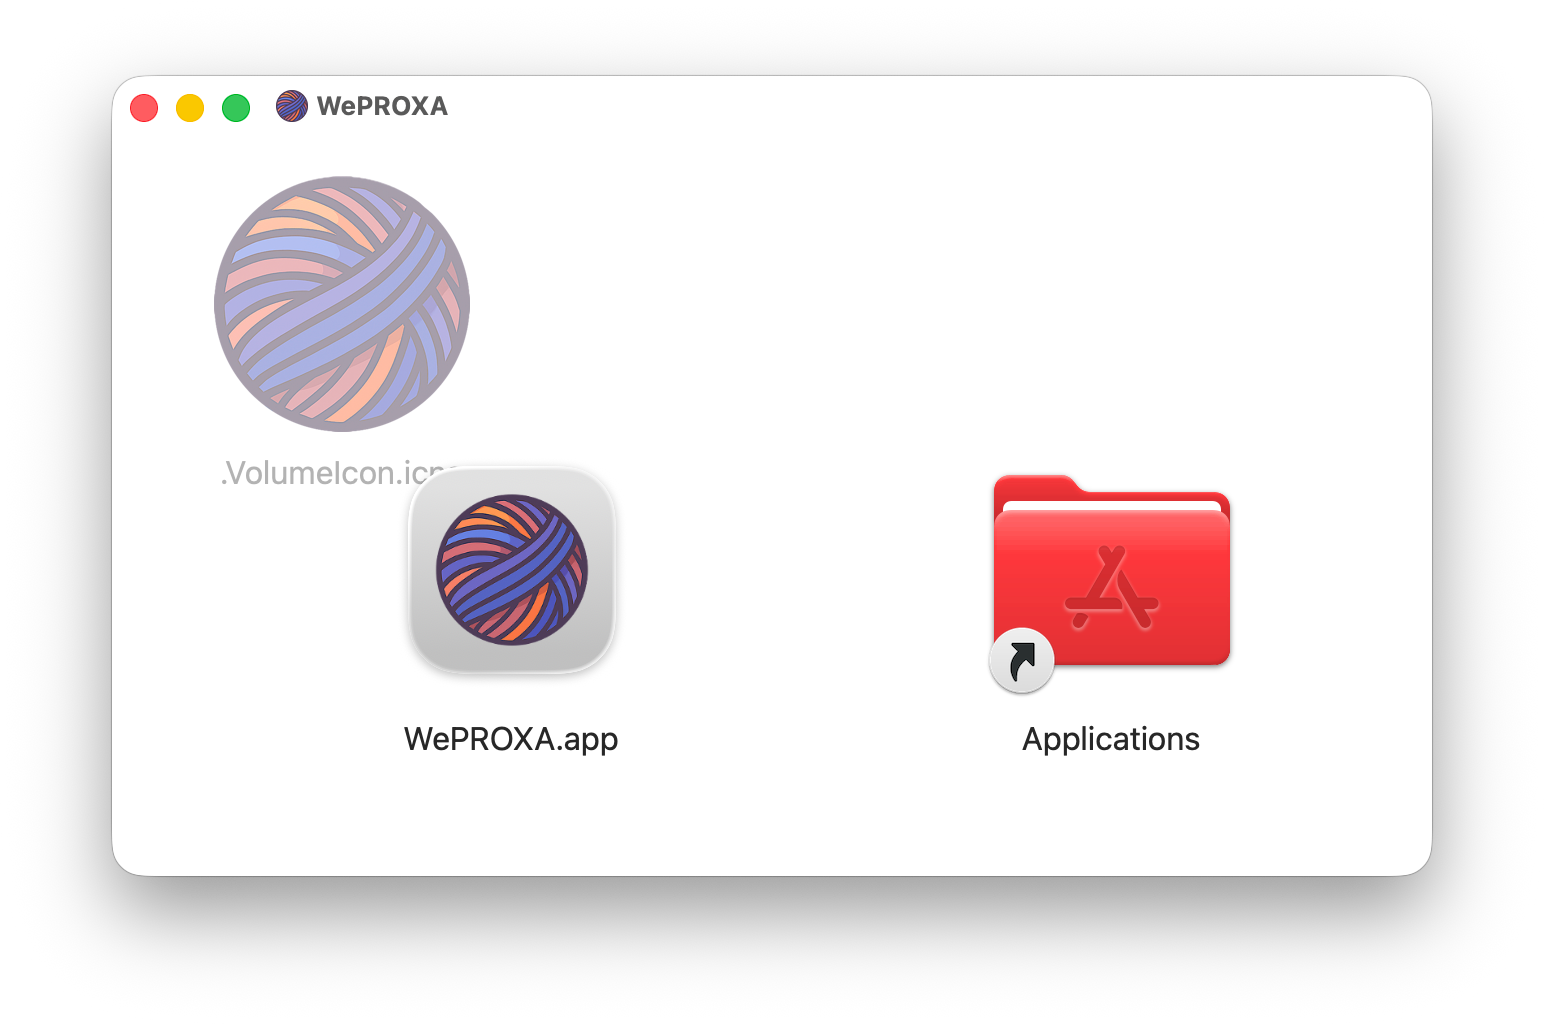
Download WePROXA for your operating system and processor.
2. Launch WePROXA and start the proxy
Section titled “2. Launch WePROXA and start the proxy”Open WePROXA, then select the play button in the toolbar. The shortcut is Command + P on macOS and Ctrl + P on Windows.
WePROXA starts listening on its configured proxy port and configures the operating system proxy for supported apps. The default port is 4545. Leave Remote capture / LAN access off for this first test; it is only needed when another device connects to your computer.
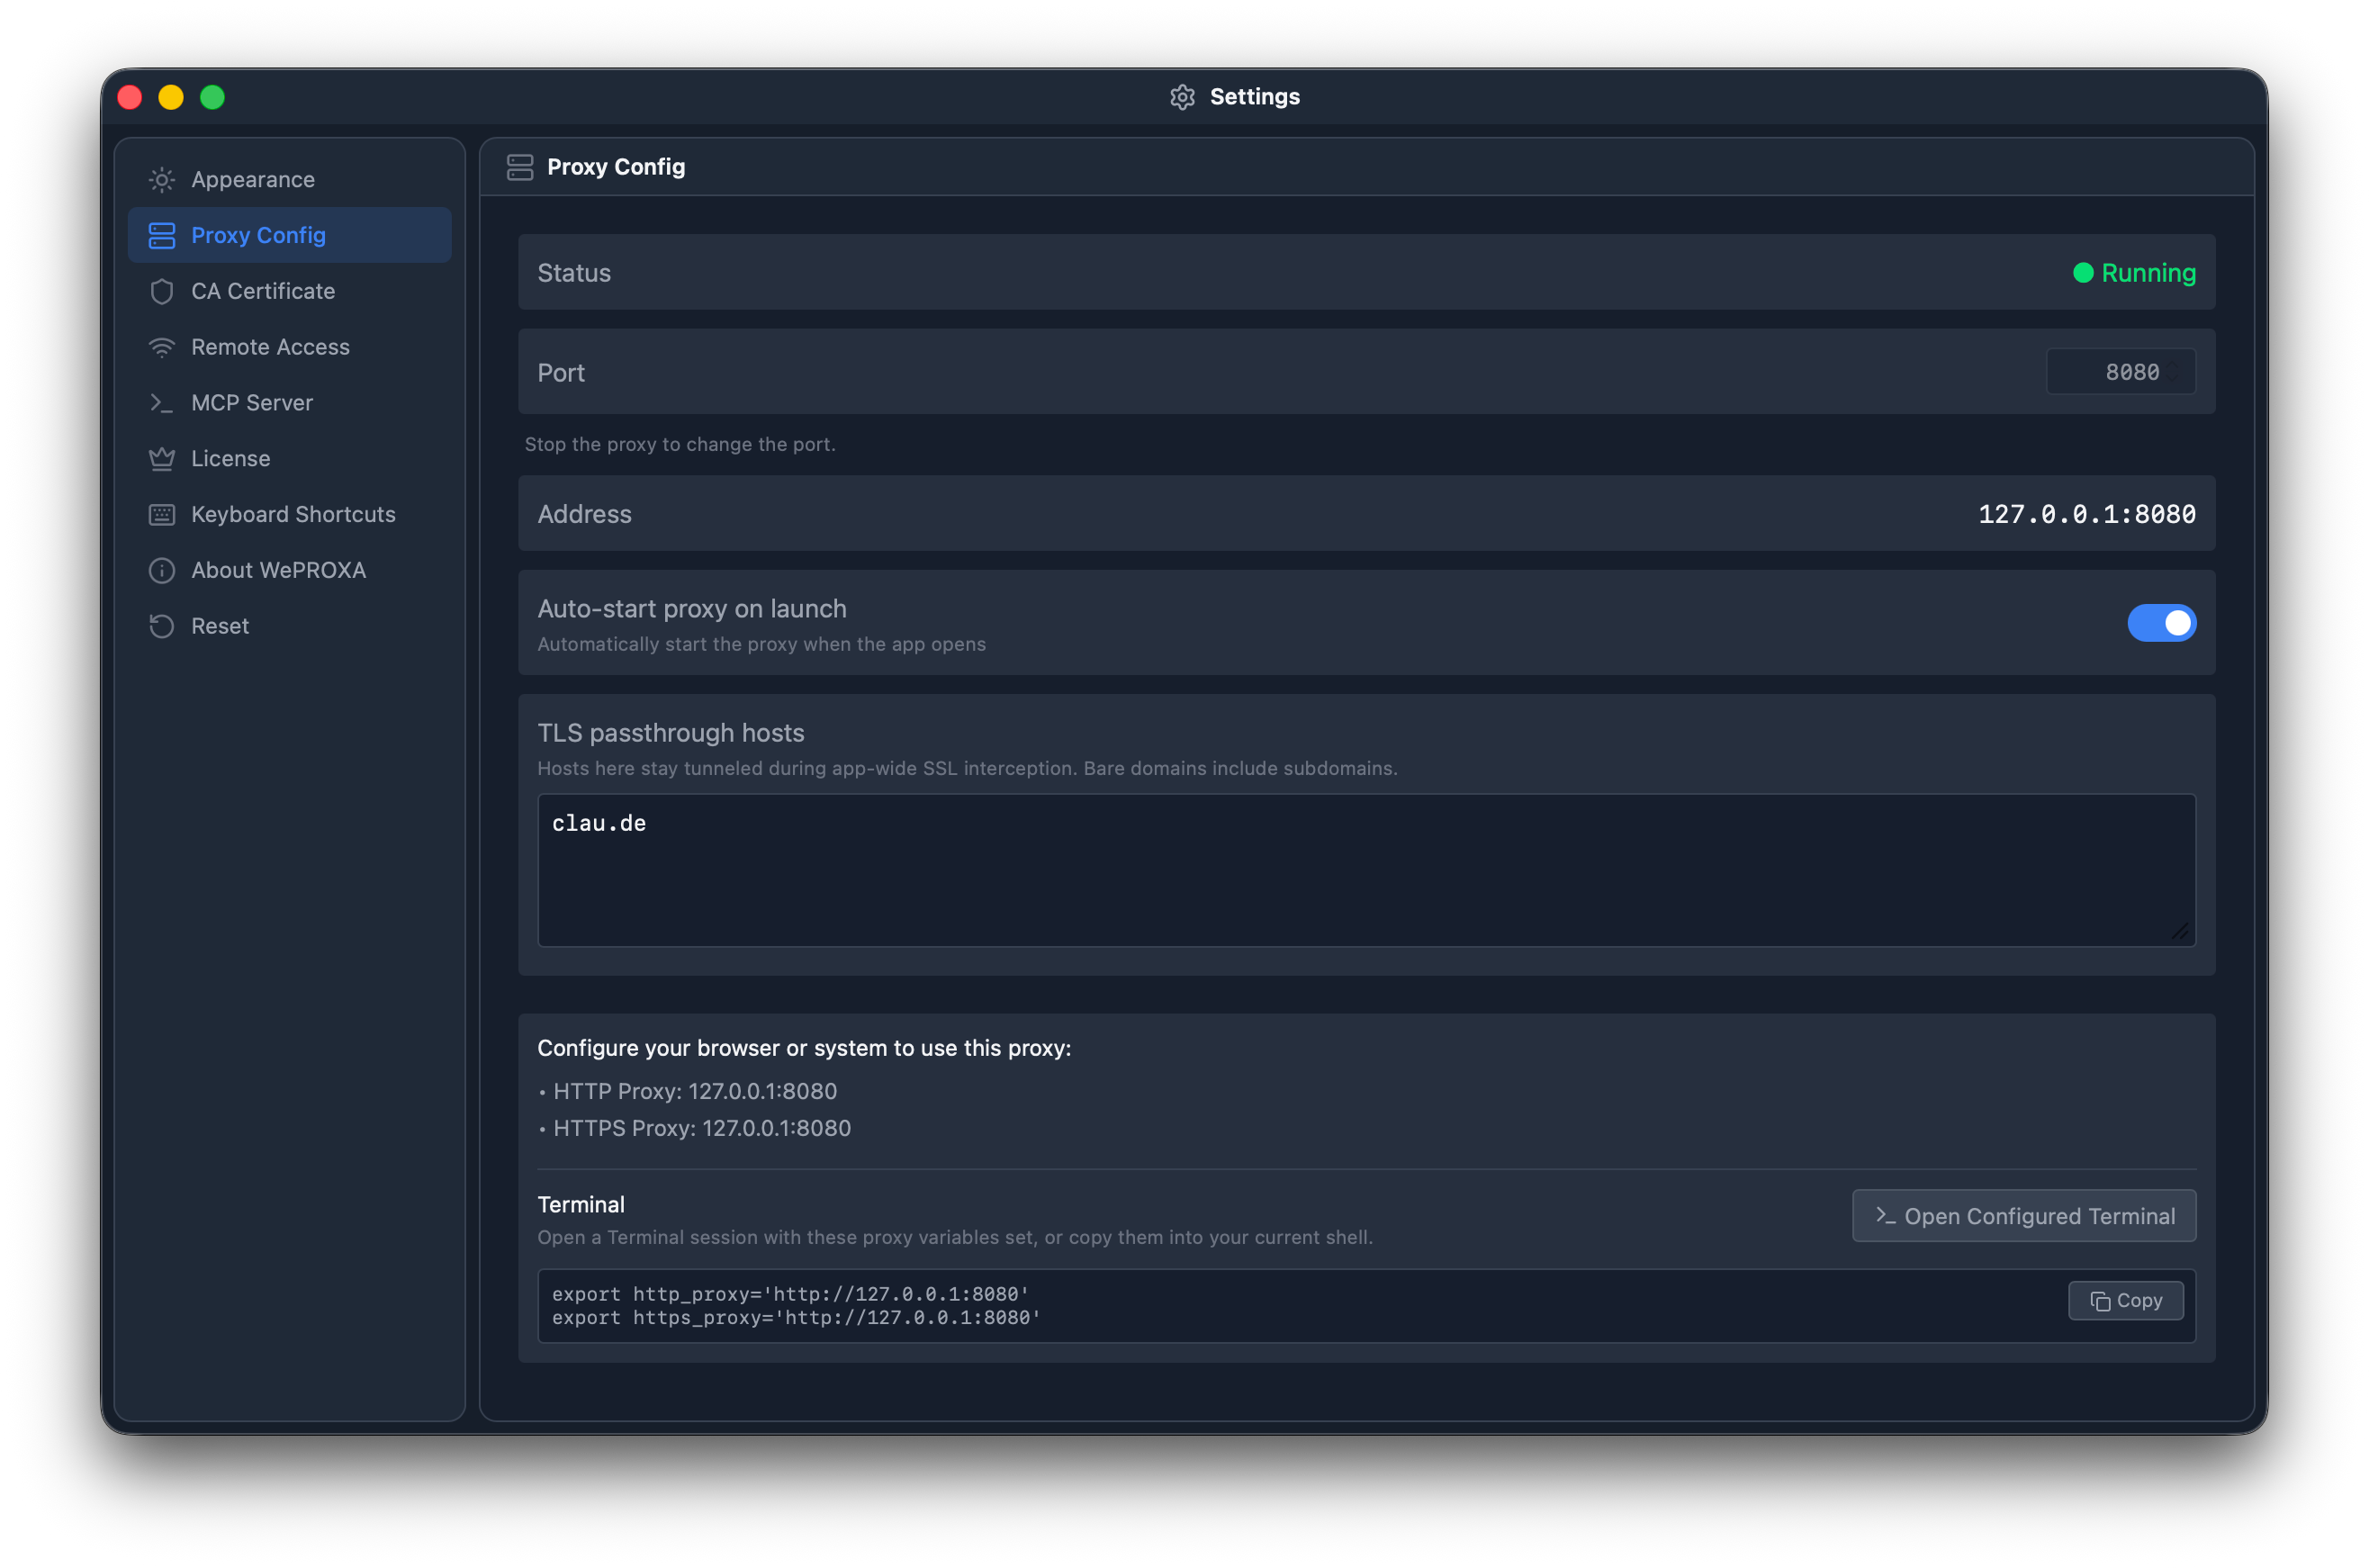
The active proxy control confirms that WePROXA is ready to capture traffic.
Open a browser and visit any ordinary HTTP or HTTPS page. Requests should begin appearing in the center list. At this stage, HTTPS traffic may appear only as encrypted tunnels because WePROXA does not decrypt every host automatically.
3. Trust the WePROXA certificate
Section titled “3. Trust the WePROXA certificate”HTTPS encrypts the request path, headers, and body. To show those fields, WePROXA creates a local root CA certificate and uses it only for the hosts you choose to inspect.
Open Settings → CA Certificate:
- On macOS, select Install to macOS and complete the Keychain trust prompt.
- On Windows, follow the in-app Learn More flow or the Windows HTTPS certificate guide to trust the certificate for the current user.
This is a one-time step unless you regenerate or remove the certificate. Keep the private key on your computer, and remove the CA from the system trust store when you no longer want HTTPS inspection.
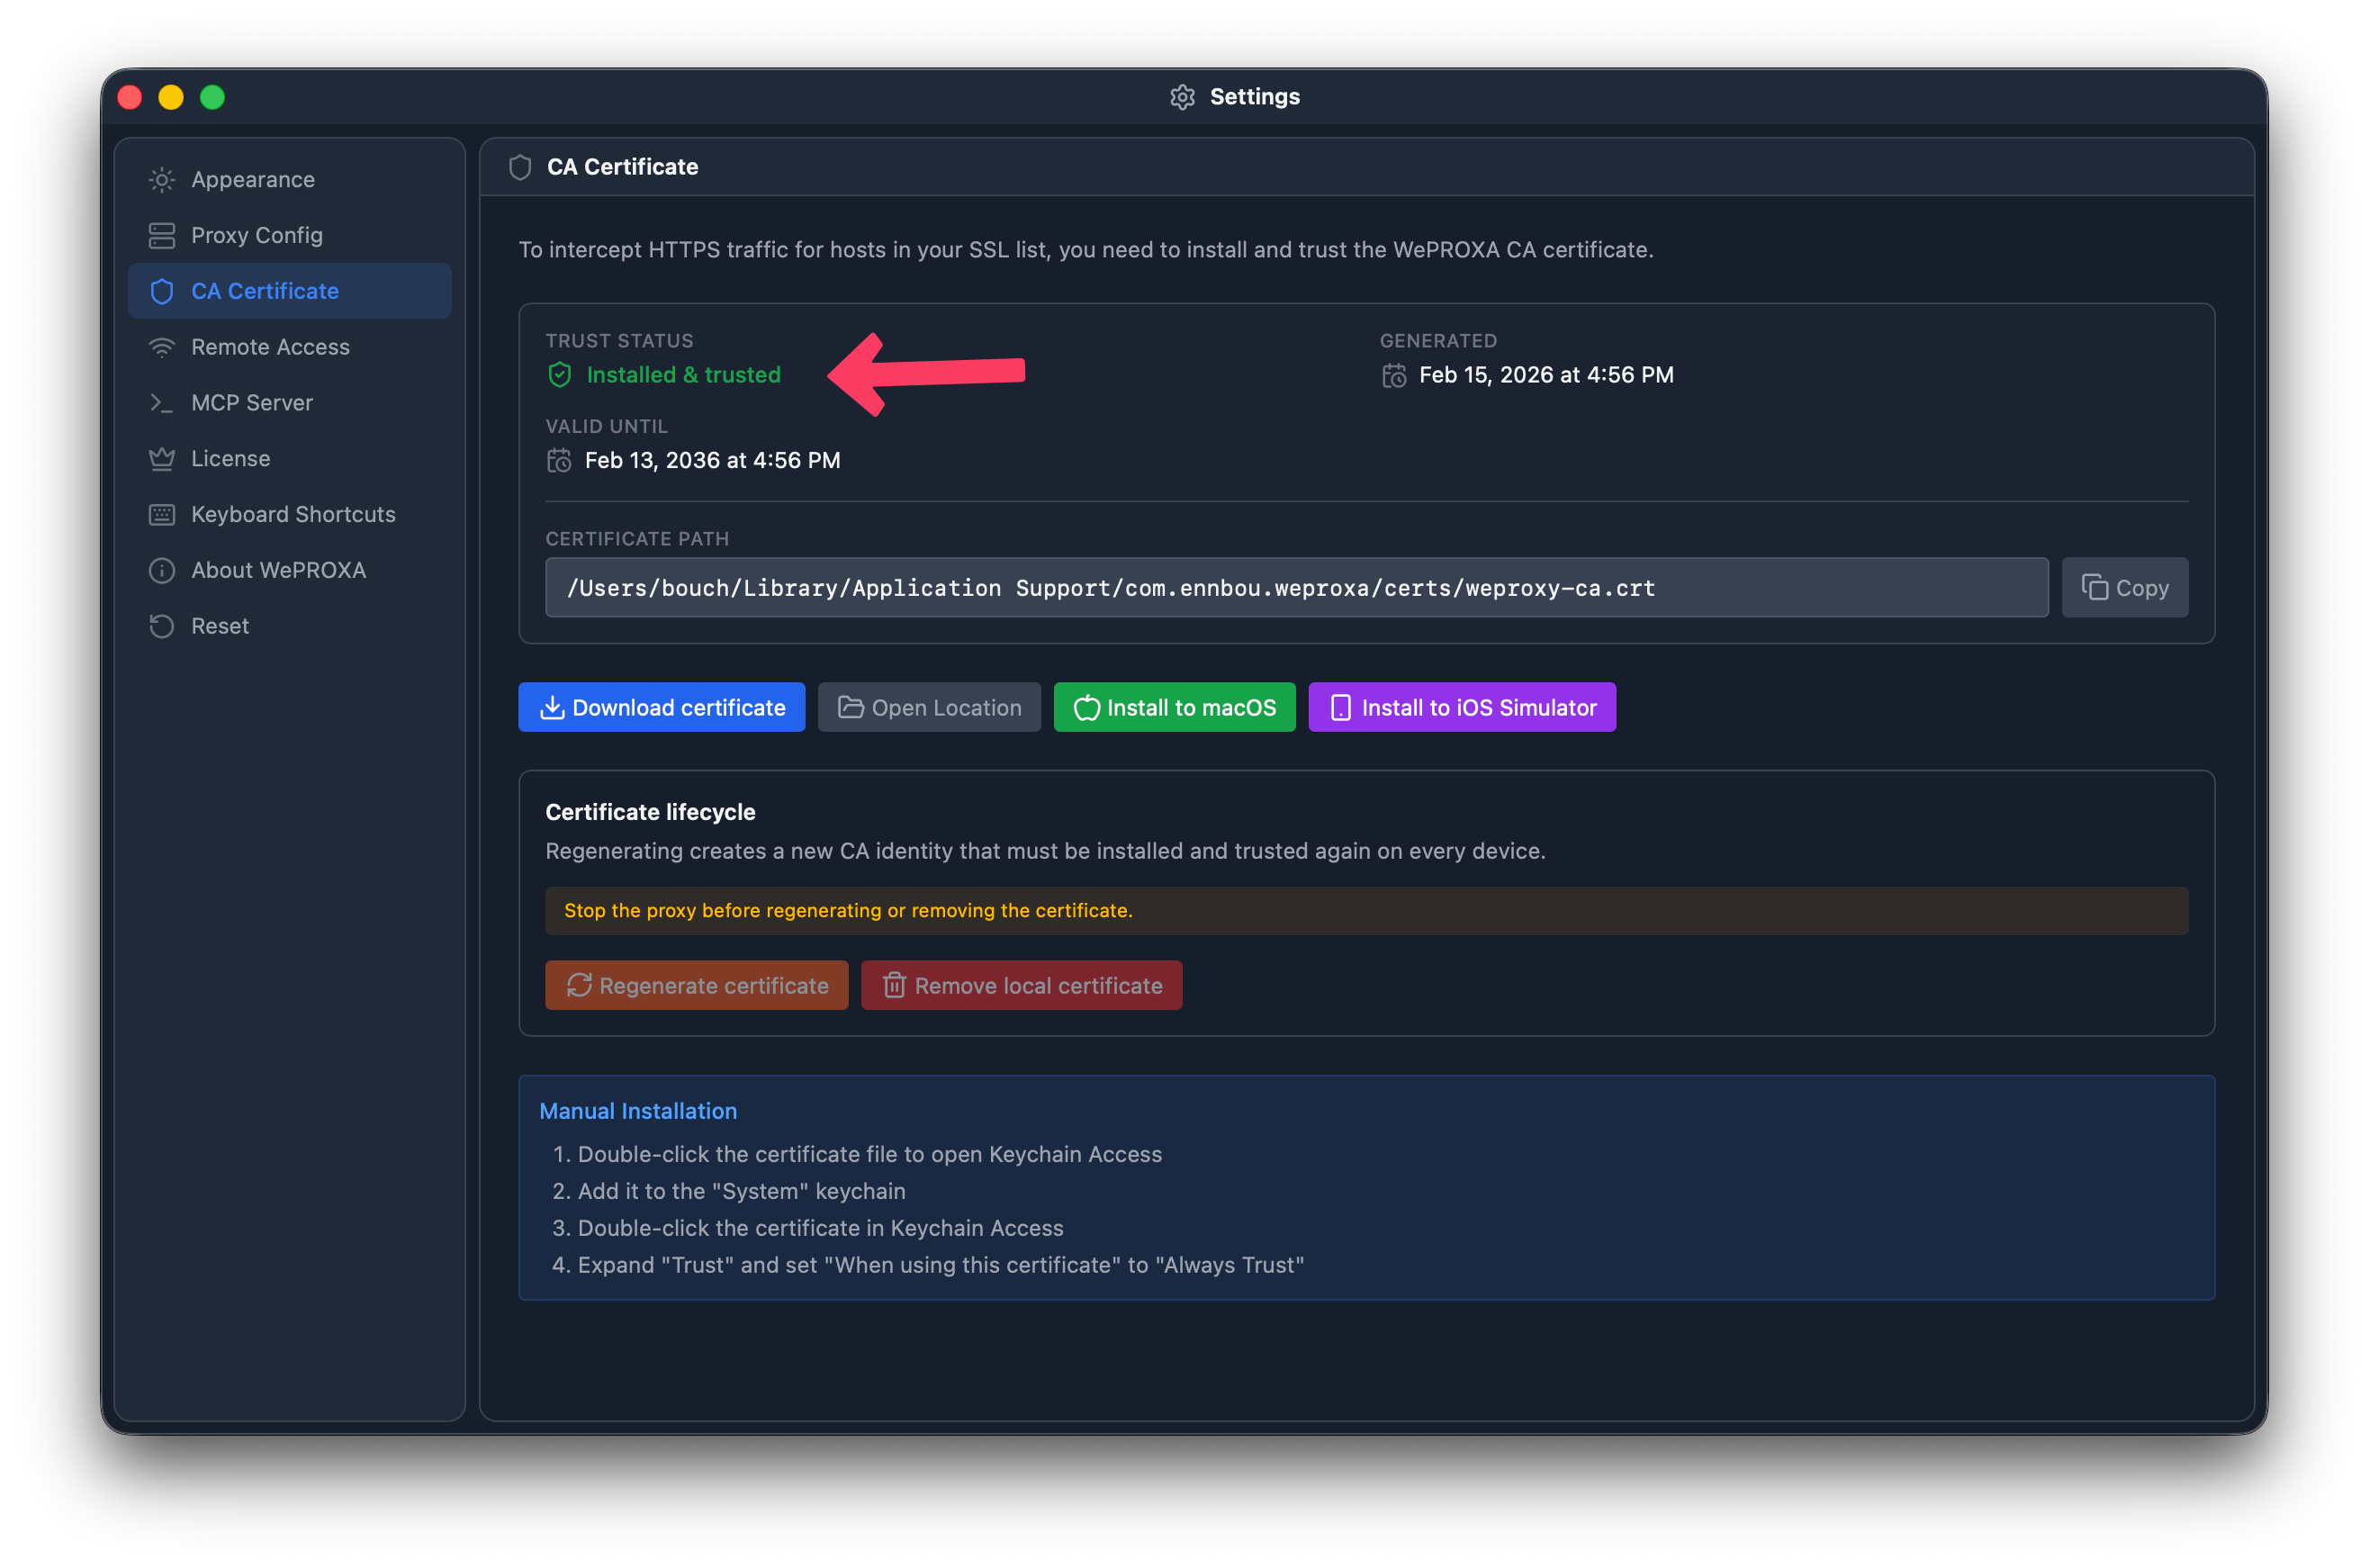
A trusted CA certificate makes the selected HTTPS hosts readable.
4. Enable SSL inspection for the test host
Section titled “4. Enable SSL inspection for the test host”Select the lock icon in the toolbar and add:
postman-echo.comYou can also right-click an existing request to that host and choose Enable SSL for postman-echo.com. Targeting only the hosts you need keeps the capture focused and avoids decrypting unrelated traffic.
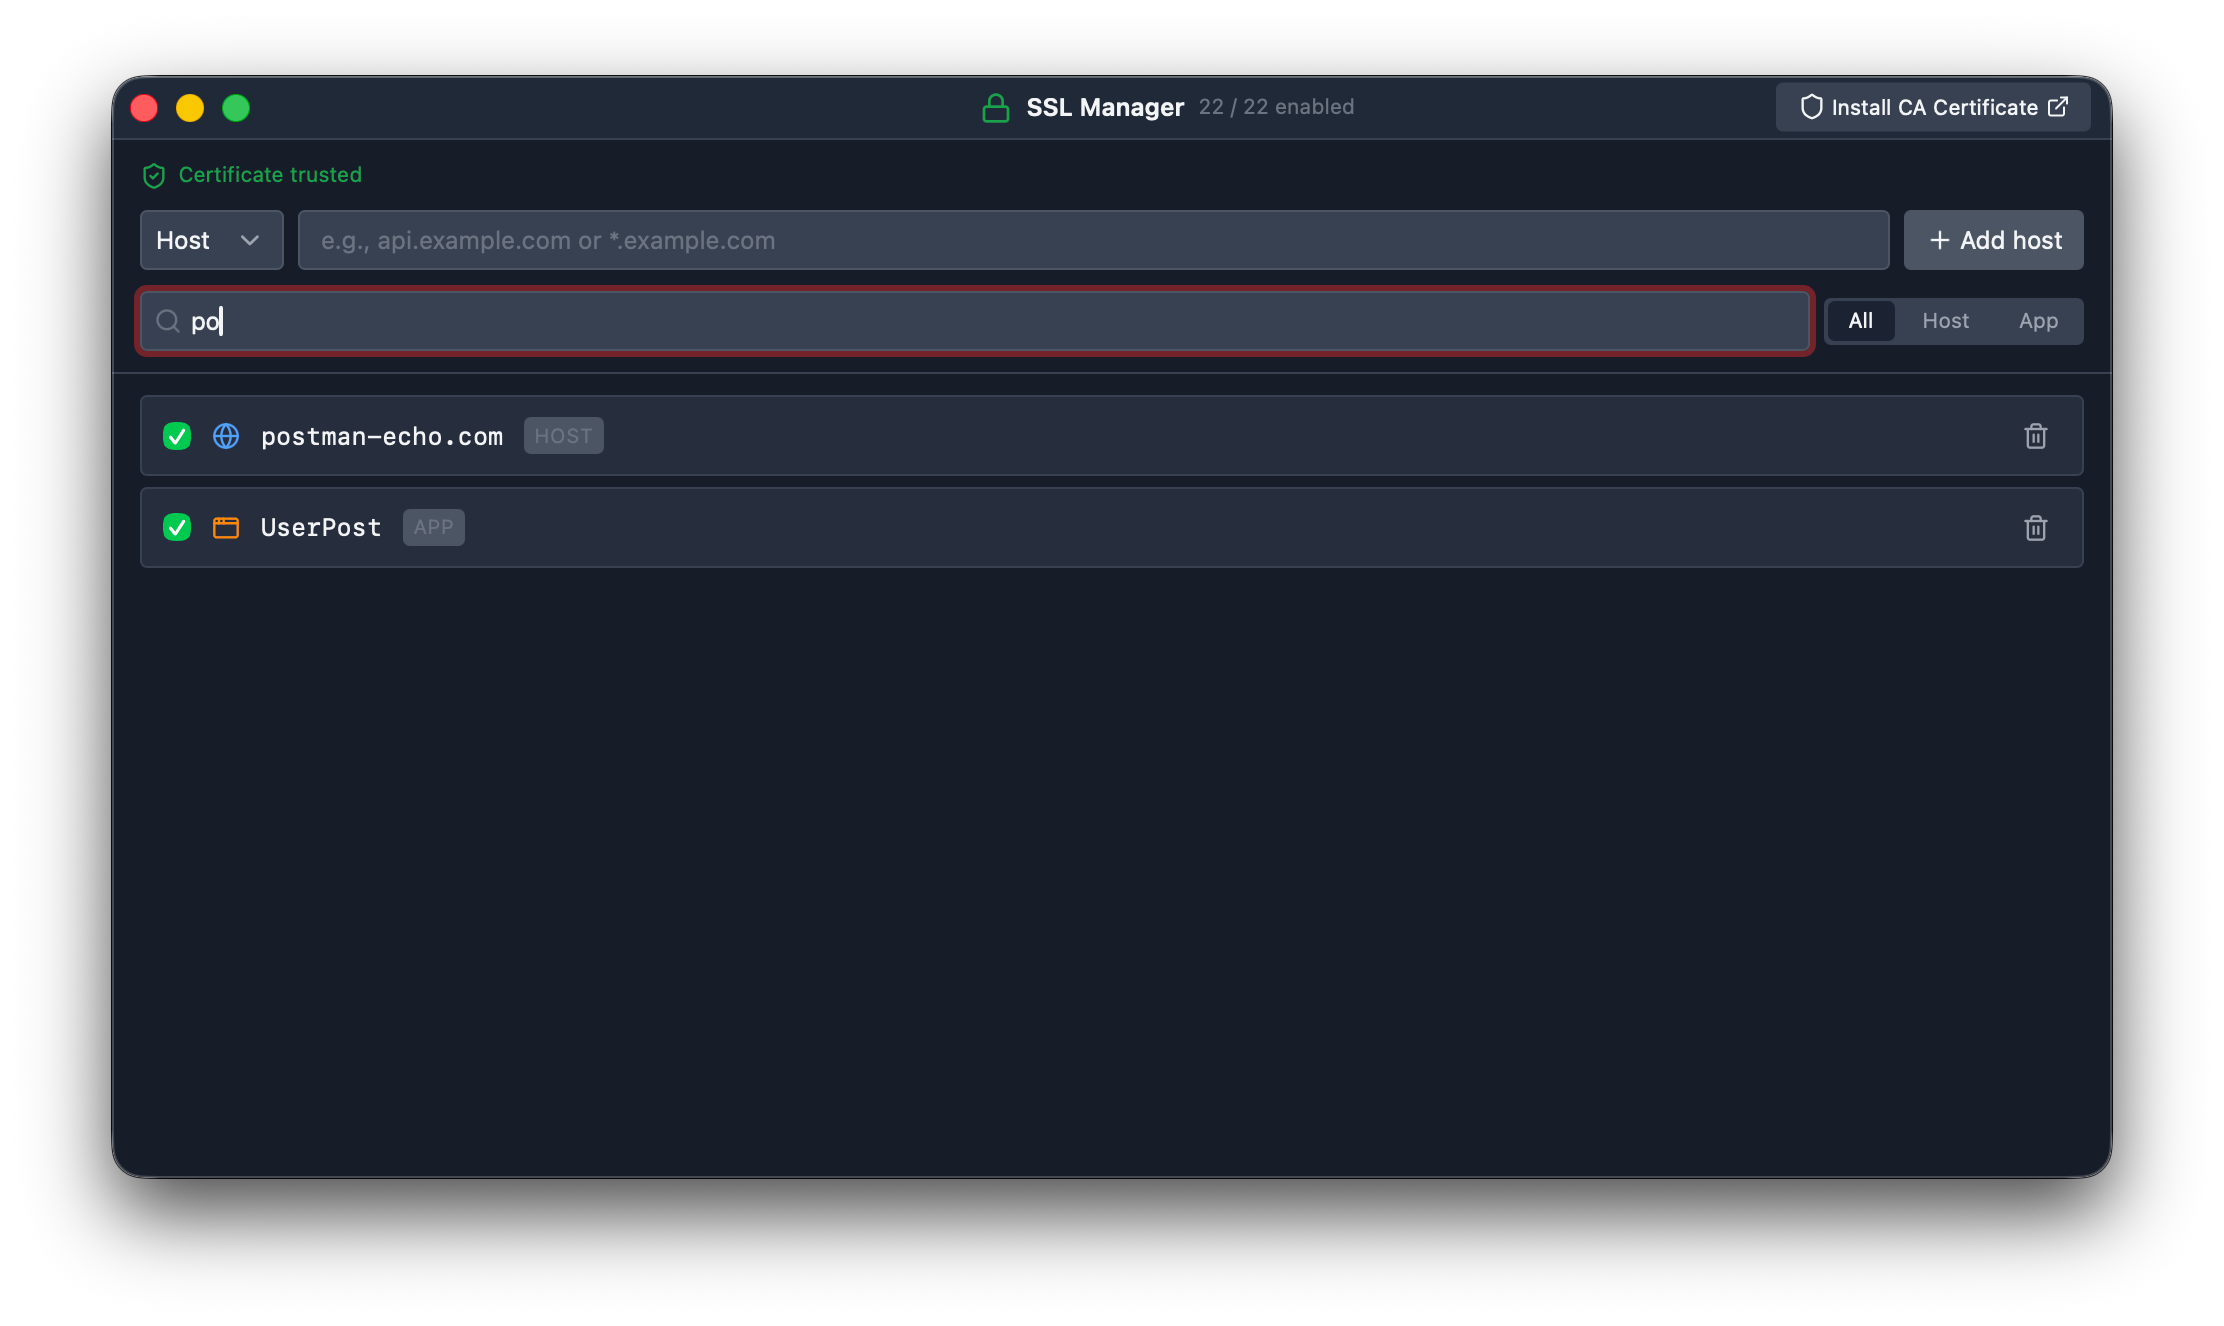
Add only the HTTPS hosts you intend to inspect.
5. Capture a response body
Section titled “5. Capture a response body”Open this URL in your browser:
https://postman-echo.com/get?source=weproxa
Postman Echo returns a JSON description of the request it received. In WePROXA:
- Find the
GETrequest whose host ispostman-echo.comand path is/get. - Select it to open Request Details.
- Under Request, open Query to see
source=weproxa. - Under Response, open Body to see the formatted JSON response.
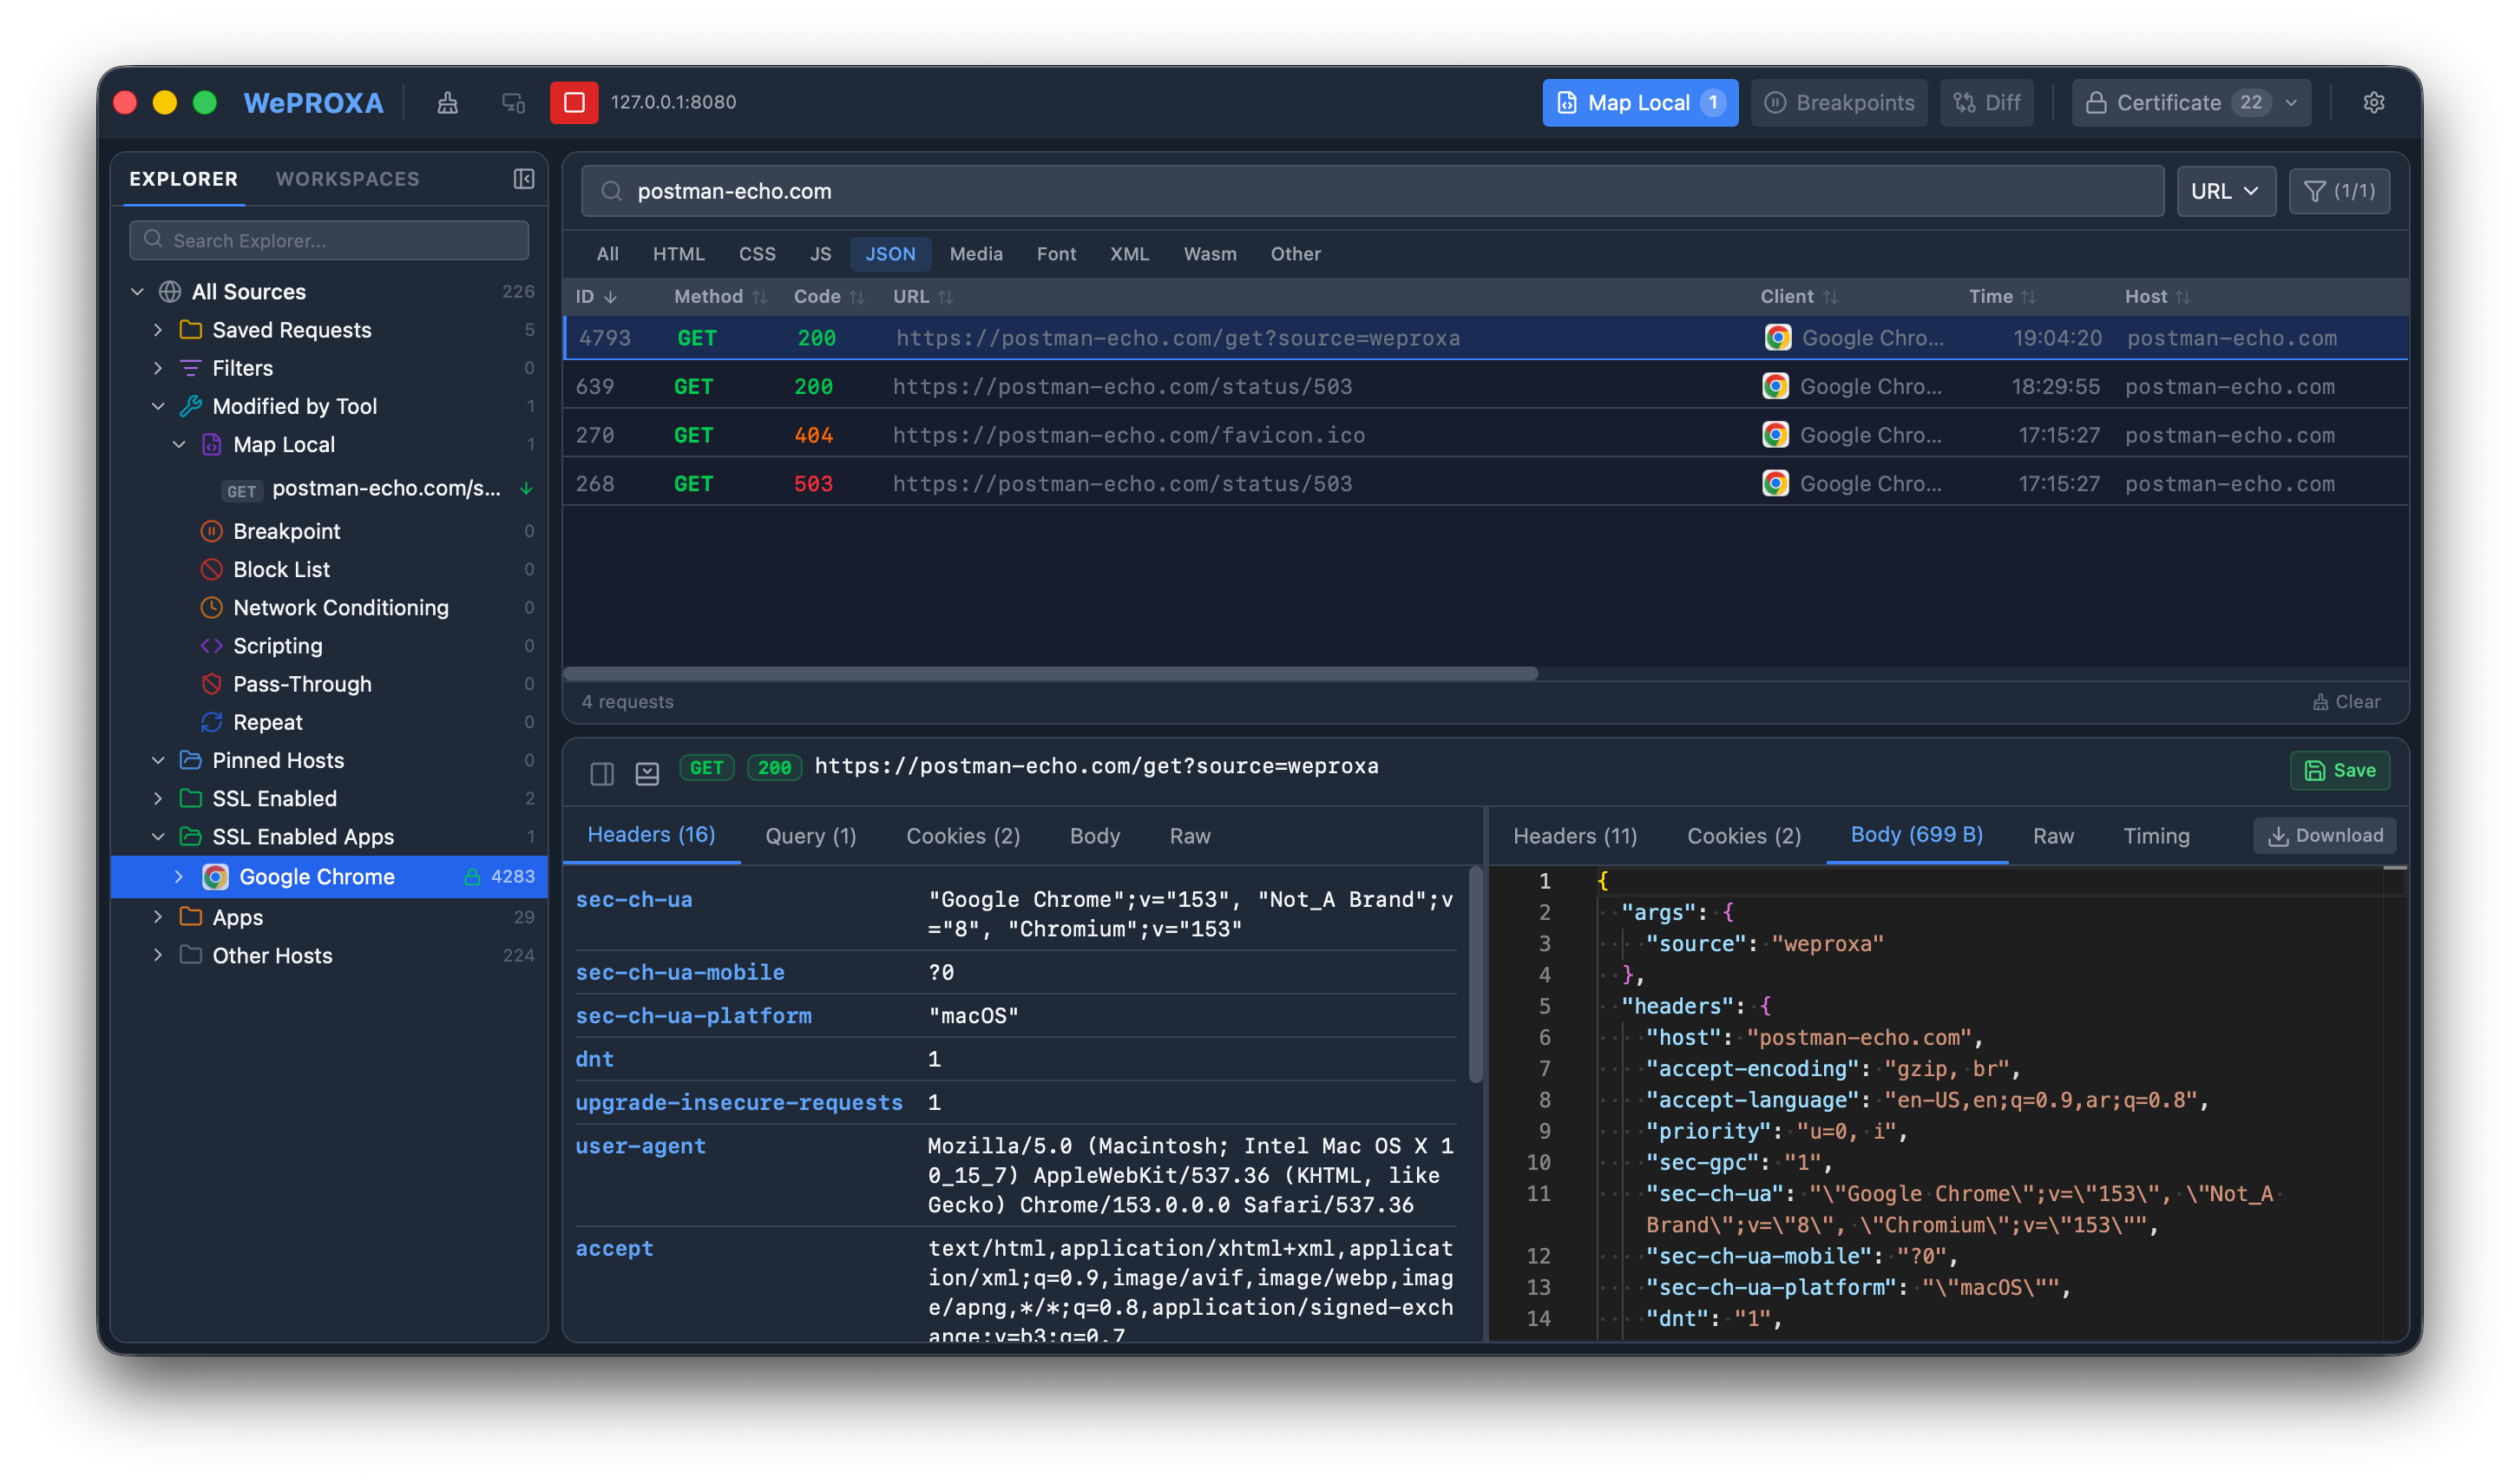
The Response Body tab formats the JSON returned by Postman Echo.
6. Capture a request body
Section titled “6. Capture a request body”A GET request normally has no body, so send a small POST request through WePROXA. If your proxy port is not 4545, replace it in the command.
On macOS:
curl --proxy http://127.0.0.1:4545 \ -H 'Content-Type: application/json' \ -d '{"message":"hello from WePROXA"}' \ https://postman-echo.com/postOn Windows PowerShell:
curl.exe --proxy http://127.0.0.1:4545 ` -H "Content-Type: application/json" ` -d '{"message":"hello from WePROXA"}' ` https://postman-echo.com/postSelect the new POST /post request in WePROXA. Open Request → Body to see the JSON you sent, then open Response → Body to see the same value echoed by the service.
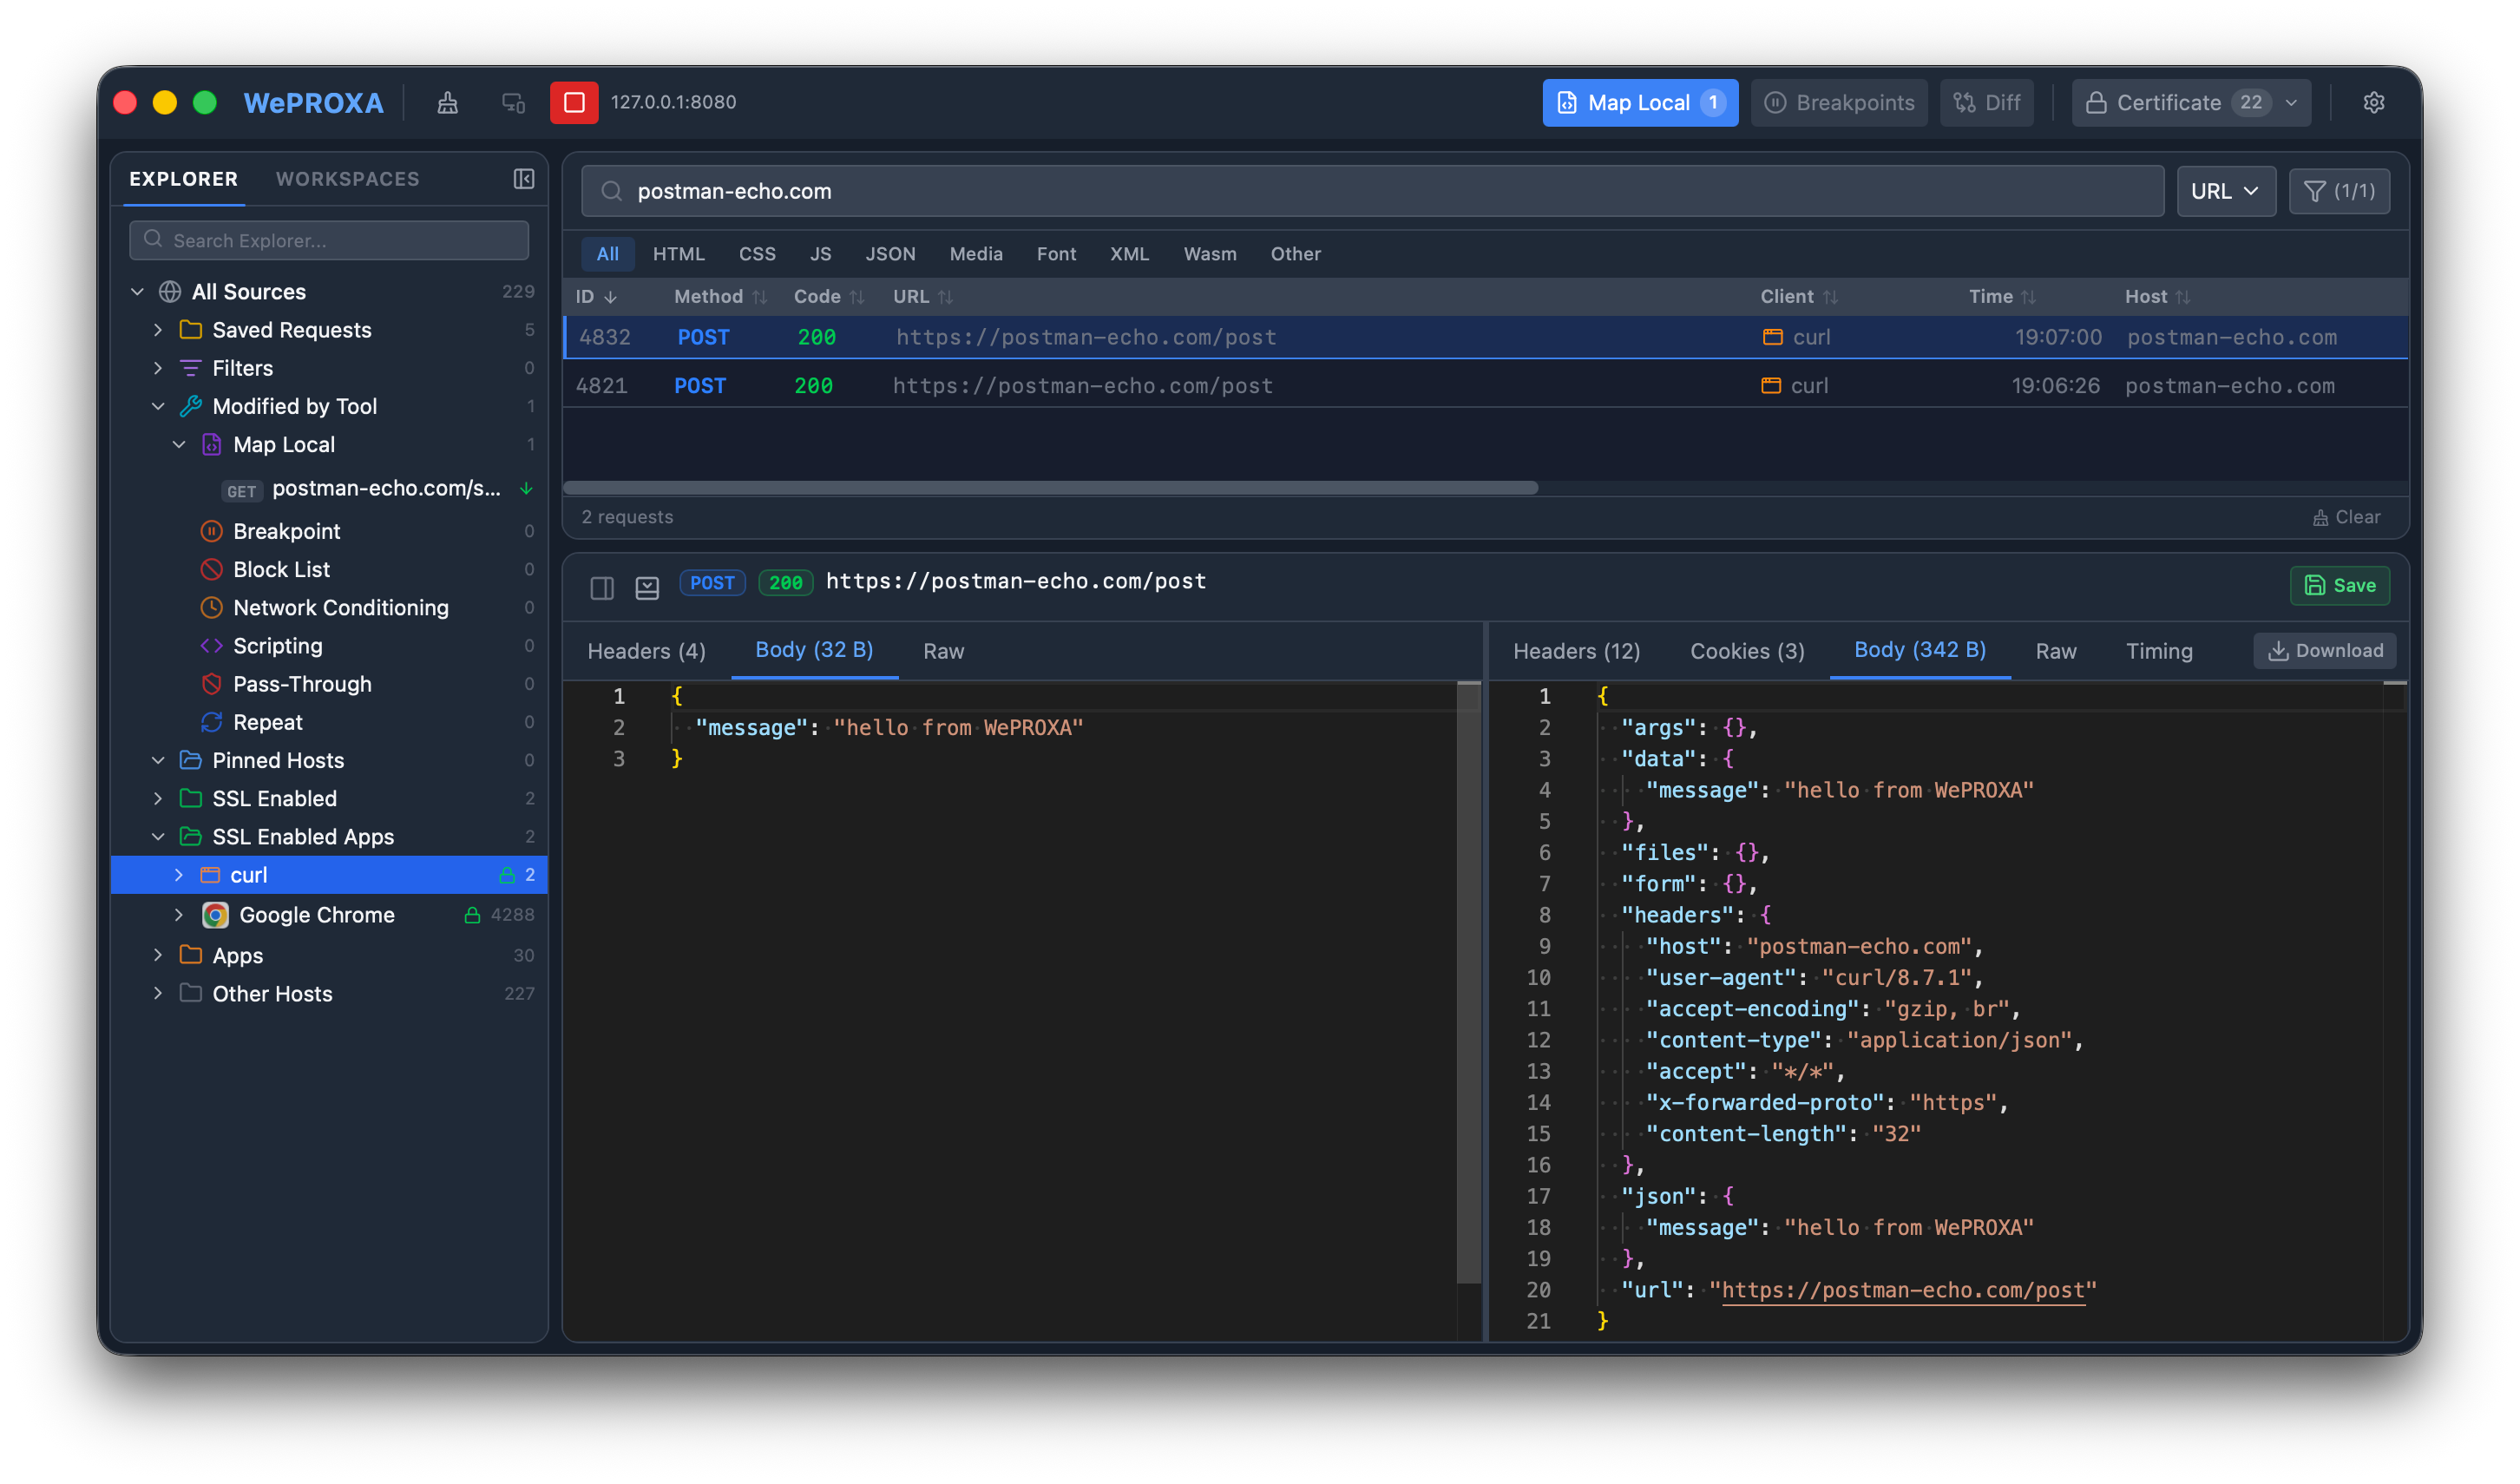
The POST capture lets you compare the JSON the client sent with the response it received.
If the body is still missing
Section titled “If the body is still missing”Use these quick checks:
- Only a
CONNECTrequest appears: add the host to the SSL interception list and try again. - The browser or terminal shows a certificate warning: confirm that the WePROXA CA is installed and trusted. Do not bypass certificate verification for real development traffic.
- Nothing is captured: confirm that the proxy is running and that the client uses the system proxy. Some terminal tools need an explicit
--proxyoption or proxy environment variables. - The Body tab says “Load body”: select it. Large bodies are loaded on demand to keep the request list responsive.
- The request body is empty: confirm that the client actually sent a body. Most
GETrequests do not have one.
See SSL Interception and Troubleshooting for deeper checks.
Where to go next
Section titled “Where to go next”Once you can see the complete exchange, you can:
- repeat a request with edited headers or JSON;
- use Map Local to return a controlled response;
- add a Breakpoint and edit traffic before it continues; or
- connect an AI client and let it investigate the capture with you.
You now have the most important debugging loop: reproduce the behavior, select the request, and compare what the client sent with what the server returned.