
Inspect Requests
Weproxa captures all HTTP and HTTPS traffic flowing through the proxy and displays it in a clean, real-time request list.
Request List
Section titled “Request List”The main view shows all captured requests in a sortable table with columns for:
- ID — Numeric request identifier
- Method — GET, POST, PUT, DELETE, etc. (shows “BLOCKED” for blocked requests)
- Status — HTTP status code with color coding (green for 2xx, blue for 3xx, orange for 4xx, red for 5xx)
- Tools — Indicates which tools modified the request or response (e.g., Breakpoint, Map Local)
- URL — Host and path displayed together (host in muted color, path in primary color)
- Client — The application or browser that made the request
- Size — Response body size
- Time — Timestamp of the request (HH:MM:SS)
- Duration — Time from request to response
Columns are sortable (click headers), draggable (reorder by dragging), and resizable.
Keyboard Navigation
Section titled “Keyboard Navigation”- Arrow Up / Arrow Down — Navigate between requests
- Enter — Expand the details panel if collapsed
Content Type Filters
Section titled “Content Type Filters”Quick-filter buttons above the list let you narrow results by content type: All, HTML, CSS, JS, JSON, Media, Font, XML, WASM, or Other.
Search Filters
Section titled “Search Filters”A search bar lets you filter requests across three scopes:
- URL — Match against the full URL, host, or path
- Request — Search request headers and body
- Response — Search response headers and body
Context Menu
Section titled “Context Menu”Right-click any request to access quick actions:
- Toggle SSL — Enable or disable HTTPS interception for the host
- Repeat Now — Re-execute the same request immediately
- Repeat With Edit — Open the repeat editor to modify the request before sending
- Add to Diff — Select requests to compare side by side
- Map Local — Create a Map Local rule pre-filled with the request’s URL
- Add Breakpoint — Create a breakpoint rule for the request’s URL pattern
- Add Block Rule — Block requests matching this URL
- Add Throttle Rule — Add a network conditioning rule for this URL
Request Details
Section titled “Request Details”Click on any request to open the details panel with full information:
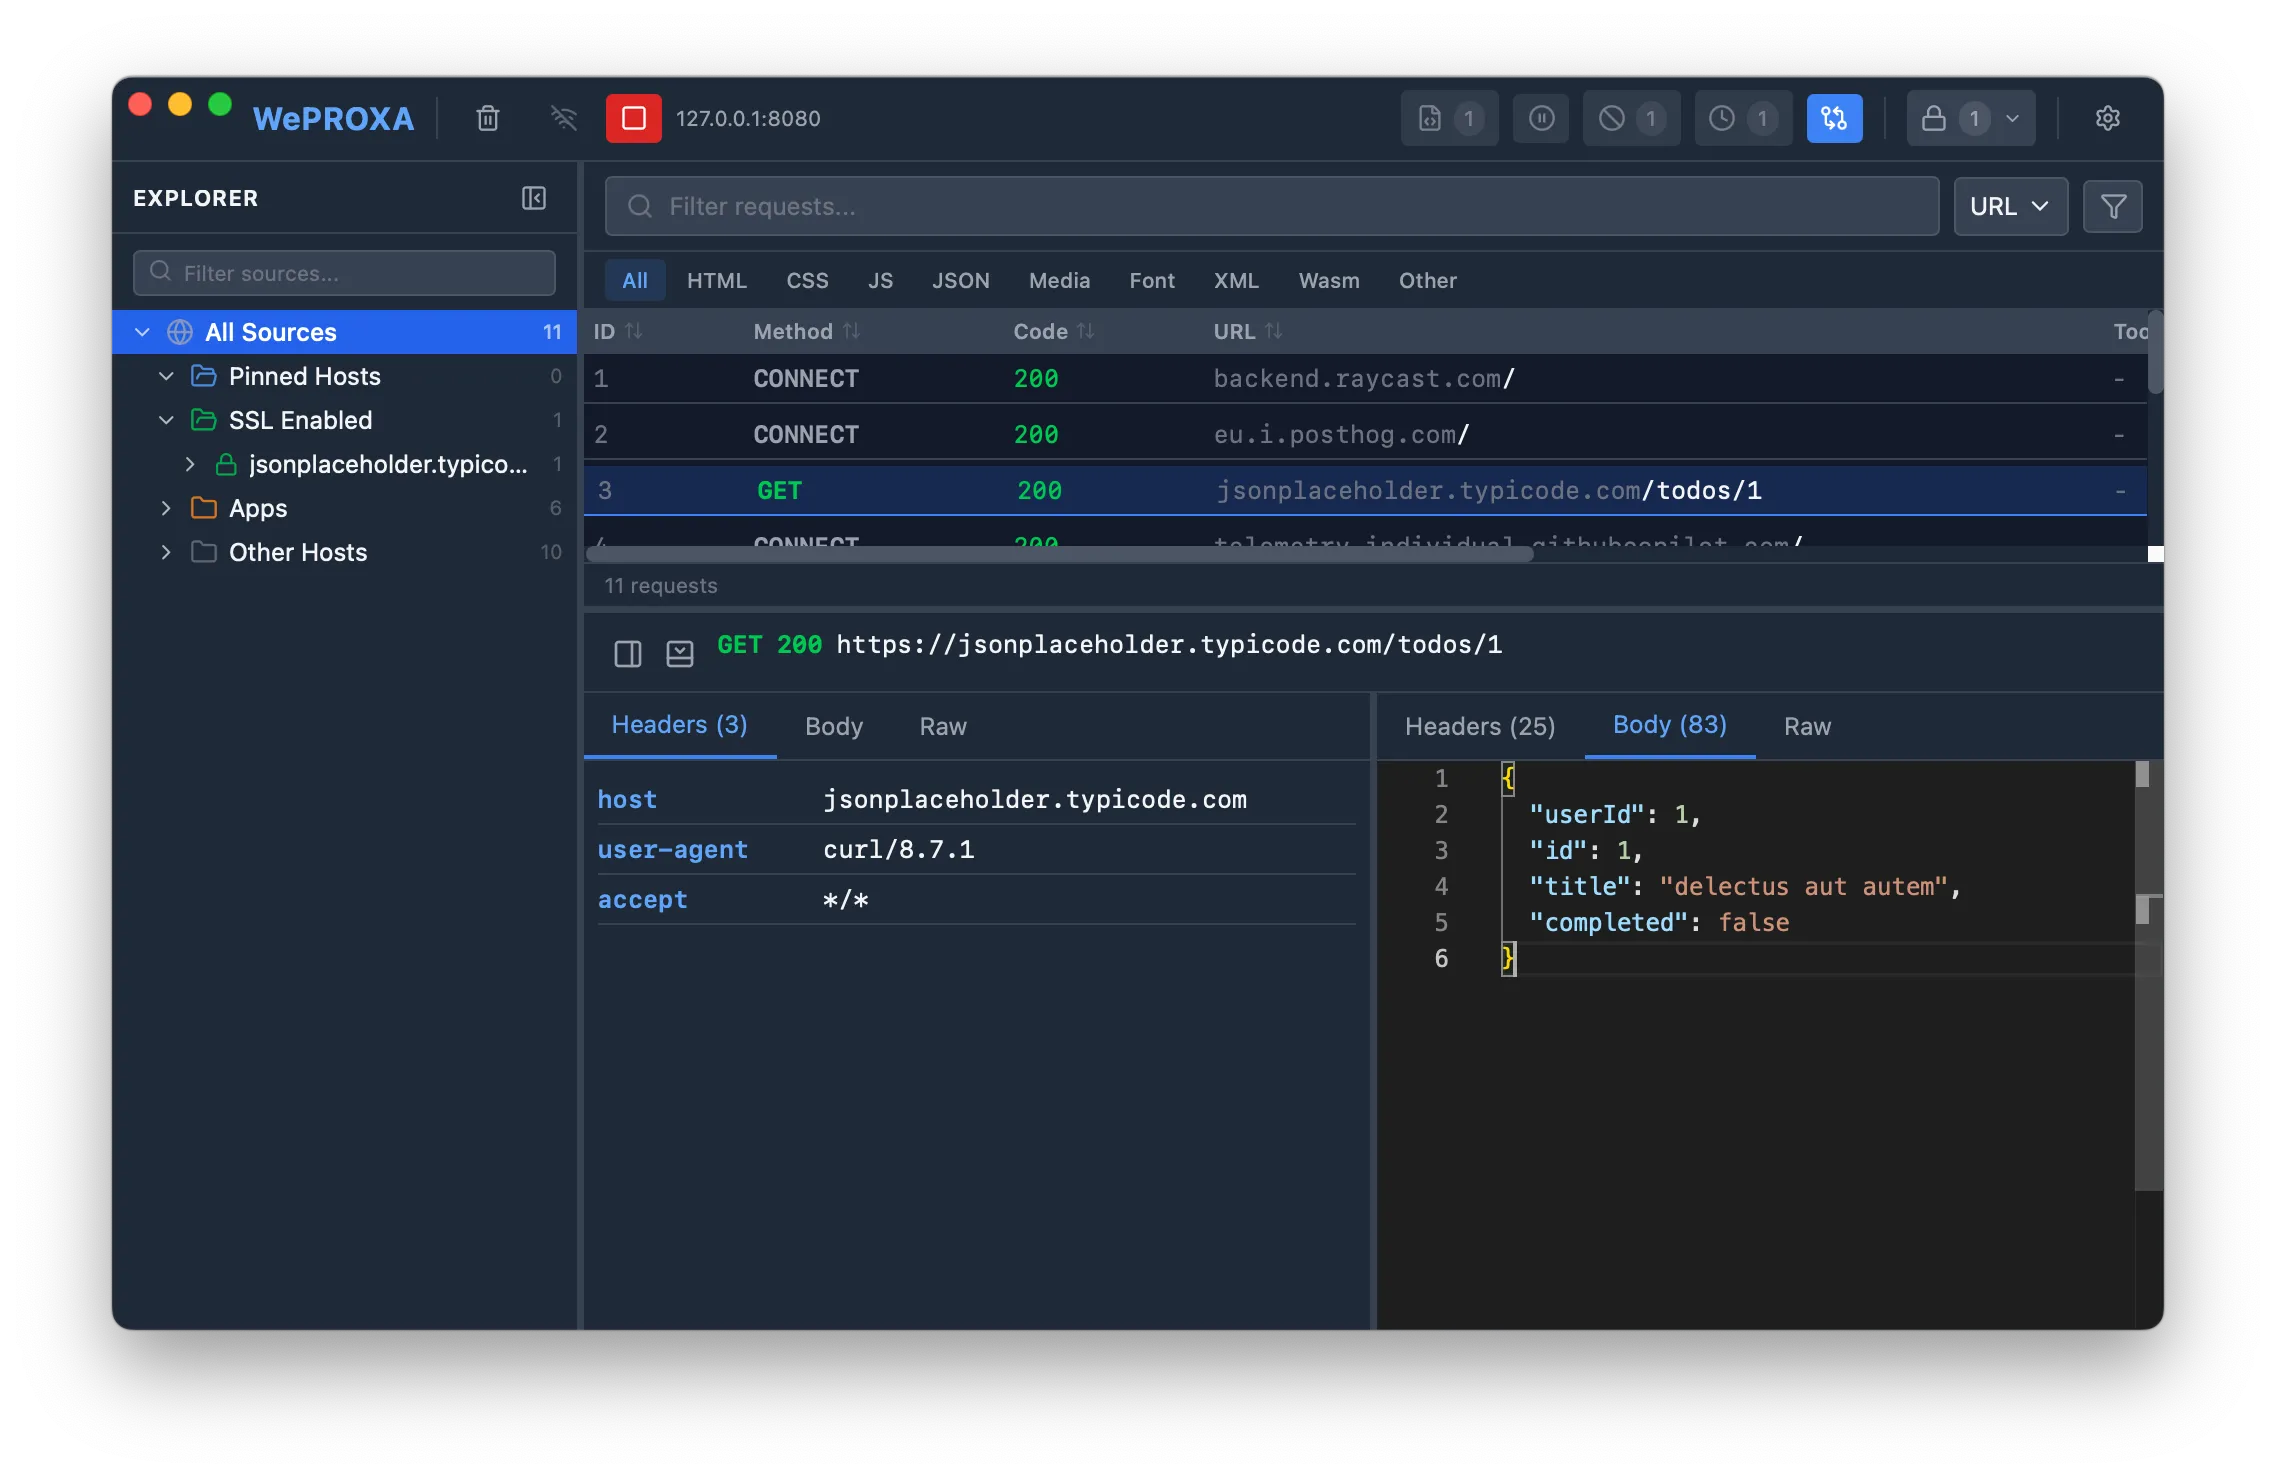
The details panel can be positioned as a right sidebar or a bottom panel, and can be collapsed when not needed.
Request Section
Section titled “Request Section”- Headers — All request headers in a key-value table (count shown in the tab label)
- Body — Request body with syntax highlighting (JSON, XML, HTML, etc.), or media preview for binary content
- Raw — Full HTTP/1.1 request format (method, path, headers, and body)
If a tool modified the request (e.g., Breakpoint, Block List), a “Modified By” indicator is shown.
Response Section
Section titled “Response Section”- Headers — All response headers in a key-value table (count shown in the tab label)
- Body — Response body with auto-formatting and syntax highlighting. JSON is pretty-printed. Images, video, and audio are previewed inline with file metadata (content type, size, dimensions)
- Raw — Full HTTP/1.1 response format (status line, headers, and body)
If a tool modified the response (e.g., Map Local, Breakpoint), a “Modified By” indicator is shown.
Source View
Section titled “Source View”Toggle to the source/tree view in the sidebar to see requests organized into sections:
- All — Every captured request
- Pinned — Manually pinned hosts for quick access (pin/unpin via right-click)
- SSL — Hosts with SSL interception enabled (toggle via right-click)
- Apps — Requests grouped by the client application or browser
- Devices — Requests from remote devices, grouped by IP address
Each host shows its request count and can be expanded into a domain/path hierarchy. A search field at the top filters hosts and apps in real time.