
Inspect Requests
WePROXA captures all HTTP and HTTPS traffic flowing through the proxy and displays it in a clean, real-time request list.
Request List
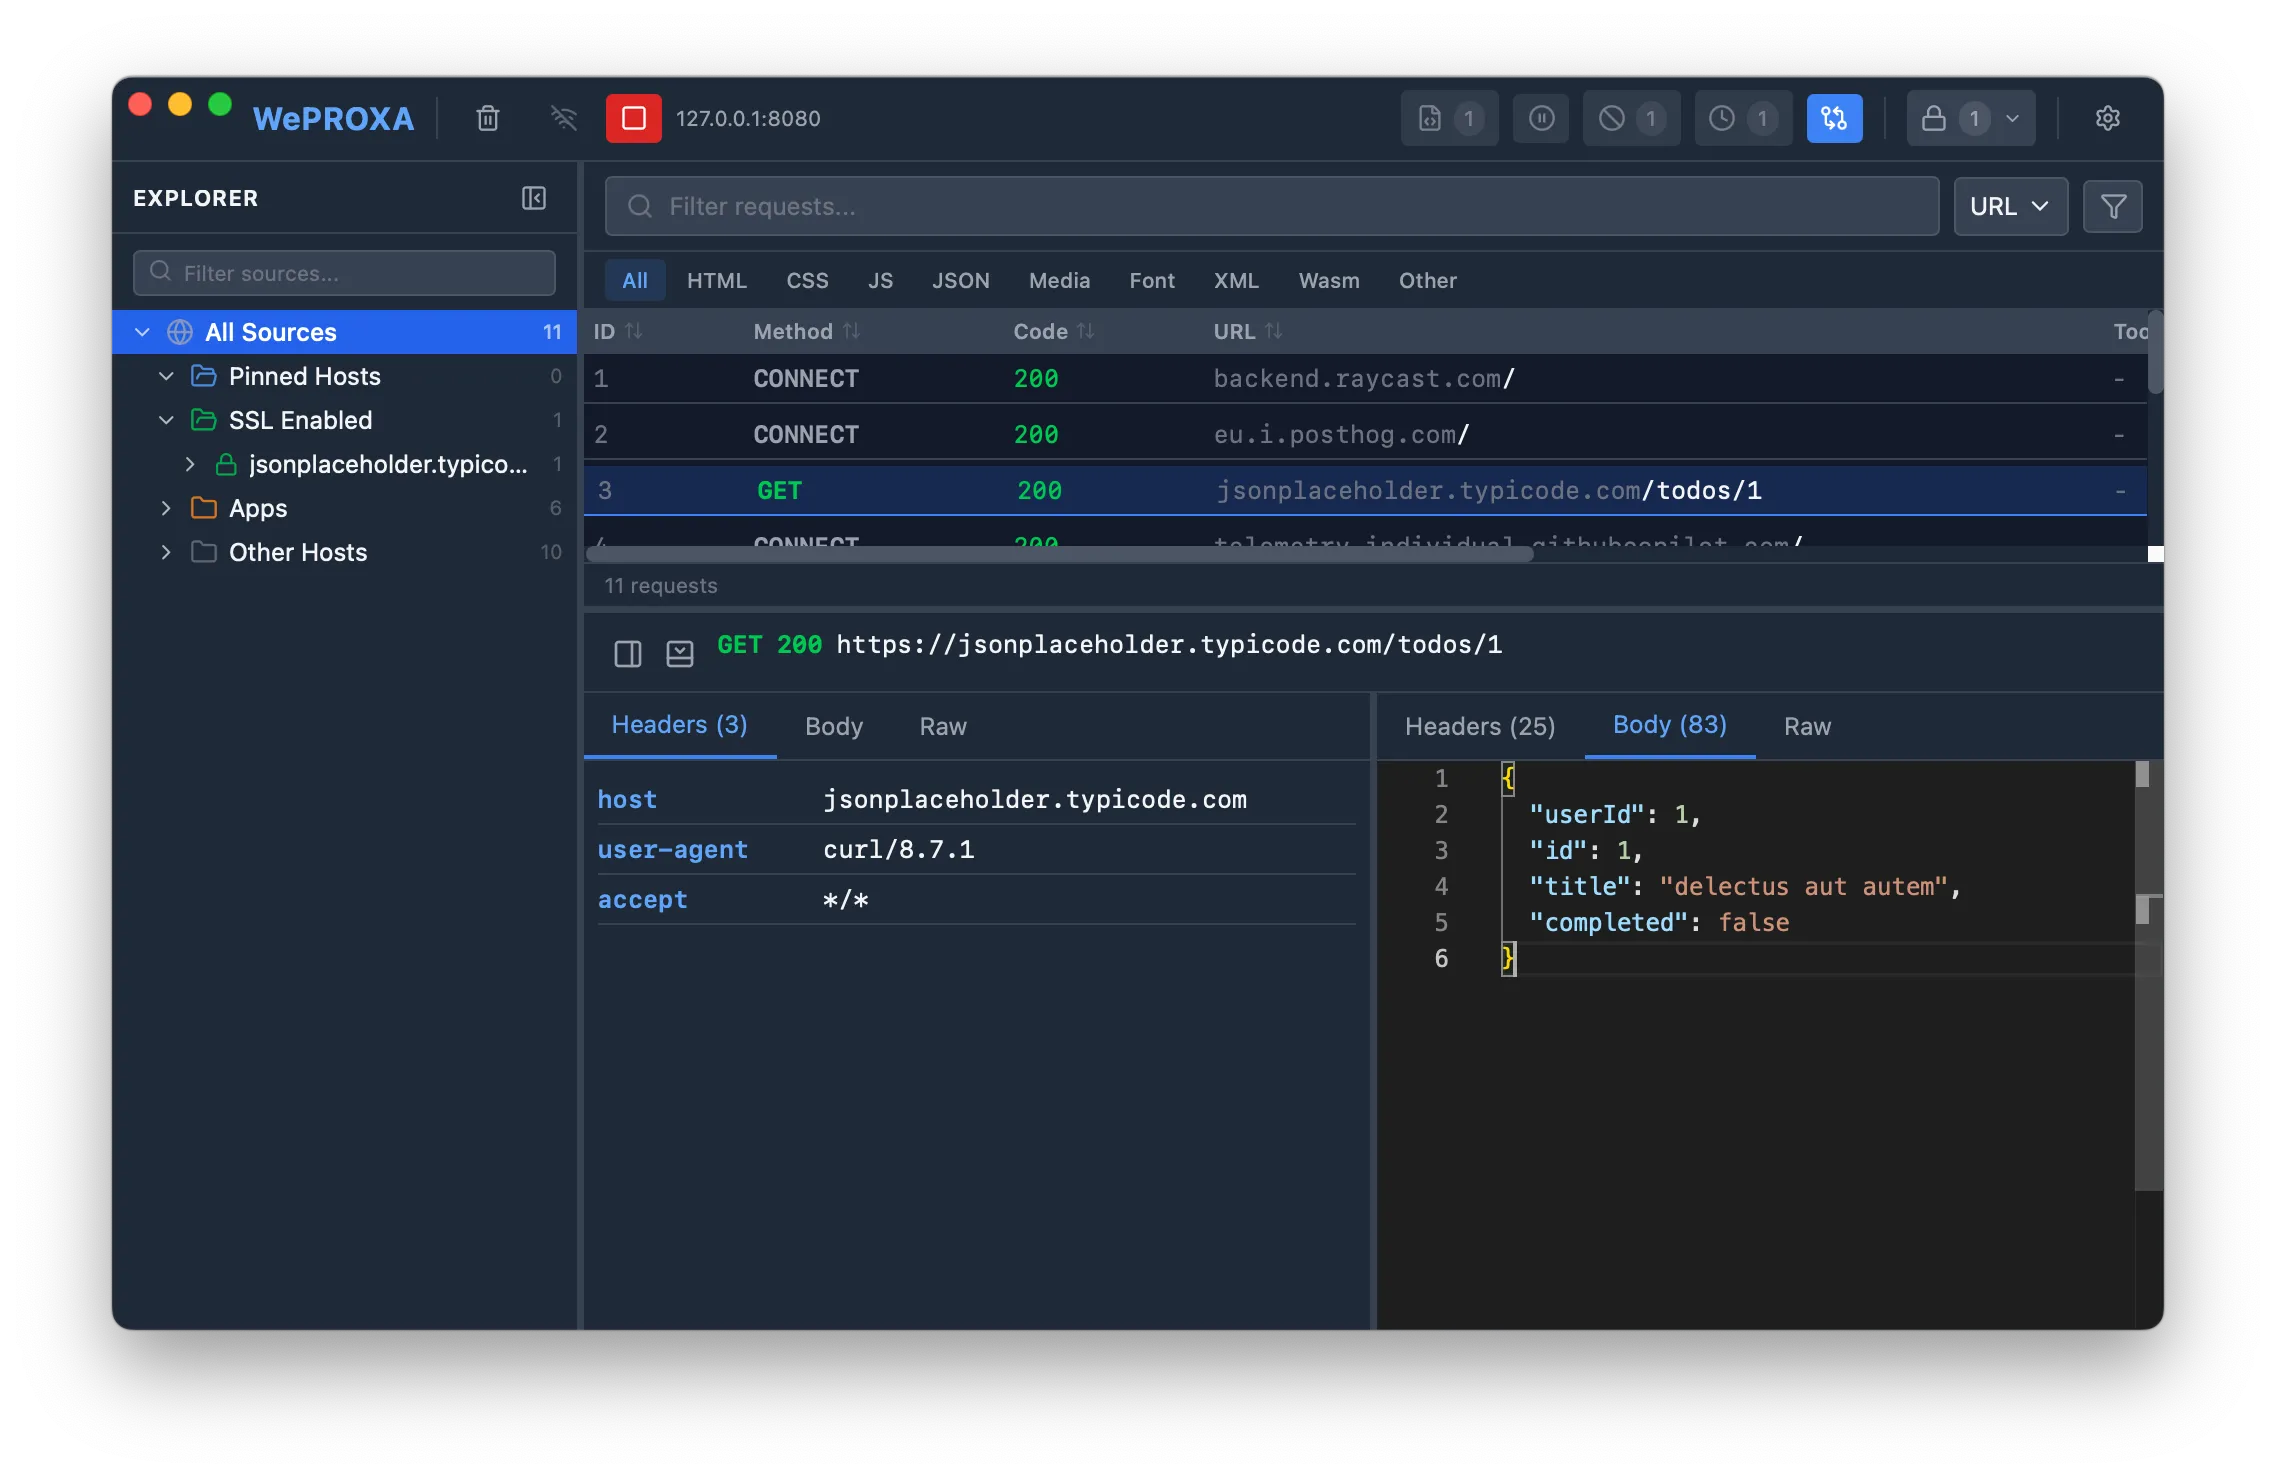
Section titled “Request List”The default layout opens with the source sidebar visible and the URL column shown, so you can immediately see where requests came from and where they are going. The main view shows all captured requests in a sortable table with columns for:
- ID — Numeric request identifier
- Method — GET, POST, PUT, DELETE, etc. (shows “BLOCKED” for blocked requests)
- Code — HTTP status code with color coding (green for 2xx, blue for 3xx, orange for 4xx, red for 5xx)
- Scheme —
HTTP,HTTPS,WS, orWSS(secure traffic shown in green) - Tools — Indicates which user-facing tools modified the request or response (e.g., Breakpoint, Map Local)
- Host — The server hostname
- URL — The full request URL
- Path — The URL path
- Query — The URL query string
- Remote Address — Resolved IP address and port of the server
- HTTP Version — Negotiated protocol (HTTP/1.1, HTTP/2.0, etc.)
- Client — The application or browser that made the request, shown with its app icon on macOS and Windows when one is available (a generic glyph is used as a fallback)
- Request Size — Request body size
- Response Size — Response body size, or tunnel byte totals after an upgraded connection closes
- Time — Timestamp of the request (HH:MM:SS)
- Duration — Time from request to response
Columns are sortable (click headers), draggable (reorder by dragging), resizable, and can be shown or hidden via the column visibility picker.
Keyboard Navigation
Section titled “Keyboard Navigation”- Arrow Up / Arrow Down — Navigate between requests
- Enter — Expand the details panel if collapsed
Content Type Filters
Section titled “Content Type Filters”Quick-filter buttons above the list let you narrow results by content type: All, HTML, CSS, JS, JSON, Media, Font, XML, WASM, or Other.
Search Filters
Section titled “Search Filters”A search bar lets you filter requests across three scopes:
- URL — Match against the full URL (host and path)
- Request — Search the HTTP method, URL, client/app name, and request body
- Response — Search the status code, content type, and response body
Body-heavy searches run on the backend with a short debounce; everything else filters instantly.
When you’re viewing Saved Requests, request and response body search is unavailable. That view filters saved snapshots by metadata only.
Context Menu
Section titled “Context Menu”Right-click any request to access quick actions. Related actions are grouped into nested submenus you can navigate with the mouse or keyboard:
- Filter — narrow the request list to the Same Host or Same Client as the selected request (Pro; see Advanced Filtering)
- Copy as cURL — Copy the request as a
curlcommand - Enable / Disable SSL for {host} — Toggle HTTPS interception for the request’s host
- Repeat — Choose Repeat Now to re-execute immediately, or Repeat with Edit… to modify the request first
- Tools — Create a rule from the request:
- Add to Diff — Select requests to compare side by side
- Map Local — Create a Map Local rule pre-filled with the request’s URL
- Add Breakpoint — Create a breakpoint rule for the request’s URL pattern
- Add Block Rule — Block requests matching this URL
- Add Throttle Rule — Add a network conditioning rule for this URL
The context menu only shows actions that apply to the selected request. Internal lifecycle markers, such as upgraded tunnel handling, are kept out of tool labels so the list focuses on rules you configured.
On macOS and Windows, WePROXA attributes local traffic to the source application when the operating system exposes that process information. The request list and source sidebar show detected app names and icons where available, with a generic client label used as a fallback.
Request Details
Section titled “Request Details”Click on any request to open the details panel with full information:
The details panel can be positioned as a right sidebar or a bottom panel, and can be collapsed when not needed. The request method and response status are shown as compact color-coded badges at the top of the panel so they’re easy to scan at a glance.
Detail Actions
Section titled “Detail Actions”The header above the details tabs includes contextual actions:
- Save — store the currently selected live HTTPS request as a persistent snapshot for later inspection
- Delete — remove a saved snapshot when you’re viewing an item from Saved Requests
- Download — save the current response body to your system Downloads folder
Saved snapshots are available from the sidebar even after the original live request scrolls out of the session.
Request Section
Section titled “Request Section”- Headers — All request headers in a key-value table (count shown in the tab label)
- Query — The URL query string decoded into a name/value table (count shown in the tab label). This tab appears only when the request URL has query parameters, and empty names or values are shown as
(empty) - Cookies — Request
Cookieheaders parsed into individual cookie names and values - Body — Request body with syntax highlighting (JSON, XML, HTML, etc.), or media preview for binary content
- Raw — Full HTTP/1.1 request format (method, path, headers, and body)
Large request bodies load on demand so selecting a request stays responsive even when the payload is big. Body buffering is bounded so unusually large uploads cannot force WePROXA to keep unlimited data in memory.
When a request carries multiple Cookie headers, the Headers tab keeps them tidy as one combined entry while the Cookies tab breaks them into individual pairs. This is especially useful for HTTP/2 browser traffic, where clients may split cookies across multiple header fields.
If a tool modified the request (e.g., Breakpoint, Block List), a “Modified By” indicator is shown.
Response Section
Section titled “Response Section”- Headers — All response headers in a key-value table (count shown in the tab label)
- Cookies — Response
Set-Cookieheaders grouped by cookie, including attributes such asPath,Domain,HttpOnly,Secure, andSameSite - Body — Response body with auto-formatting and syntax highlighting. JSON is pretty-printed. Images, video, and audio are previewed inline with file metadata (content type, size, dimensions)
- Raw — Full HTTP/1.1 response format (status line, headers, and body)
- Frames — WebSocket frames for successful
101 Switching Protocolsresponses, with sent/received filters, payload search, opcodes, sizes, and timestamps
For large text or media responses, WePROXA shows the response metadata first and lets you click Load body only when you actually need the full content. The response Download action is available from both the body and raw views.
When a WebSocket connection is captured, WePROXA displays the request as ws:// or wss:// and opens the Frames tab automatically. See WebSocket Inspection for details.
If a tool modified the response (e.g., Map Local, Breakpoint), a “Modified By” indicator is shown.
Source View
Section titled “Source View”Toggle to the source/tree view in the sidebar to see requests organized into sections:
- All — Every captured request
- Modified by Tool — Requests changed by a tool, grouped under the tool that changed them (Map Local, Breakpoints, Block List, Network Conditioning, Scripting, or Repeat), so you can see exactly what each rule touched. Requests you replayed appear under the Repeat group. Long lists collapse behind a Show N more control
- Saved Requests — Persistent HTTPS request snapshots you explicitly saved from the details panel
- Pinned — Manually pinned hosts for quick access (pin/unpin via right-click)
- SSL — Hosts with SSL interception enabled (toggle via right-click)
- SSL Enabled Apps — Apps with SSL interception enabled, grouped as app → host → path
- Apps — Requests grouped by the client application or browser, with detected app icons on macOS and Windows when available
- Devices — Requests from remote devices, grouped by IP address
Each section can be expanded into host and path hierarchies. Saved requests get their own host/path tree, and app-based SSL rules expand as app → host → path so you can isolate one client quickly. A search field at the top filters hosts and app names in real time.
WePROXA remembers whether stable top-level groups and Modified by Tool subgroups are expanded or collapsed between launches. Traffic-derived host, app, device, and path nodes remain session-specific and start collapsed in a new session.